Research


UNETRANS: Essential Data Model for Transportation

With large amounts of data coming on line from the use of remote sensing, GPS and other technologies, there is a need for a common data model to facilitate application development and data exchange. The transportation landscape can be interpreted in different ways.  A divided highway can be shown as a single centerline running down the median, or two directional carriageways, or several lanes. A traffic circle ("roundabout") can be reduced to a simple 4-way intersection or represented as a series of short links. Bus stops, bike lanes and pedestrian overpasses can be set up with different associations and dependencies in an object oriented data framework. With each database developer taking a different view of the landscape and transportation objects, database development and data exchange are inhibited.

UNETRANS development: procedure and timetable
2000 May Administrative launch
2000 Jun 24/25 Stakeholder consultation at ESRI User Conference, San Diego CA
2000 Jul/Oct Refinement of stakeholder inputs and supporting research
Development of draft book/whitepaper and UML code
2000 Nov 3/4 European stakeholder consultation, Turin, Italy
2000 Nov/Dec Refinement and development
2000 Dec 7/8 Presentation of draft and consultation, Redlands CA
2001 Jan/Apr Final refinement and development
2001 May 11 Release of UML and white paper
TBA   Release of UNETRANS book
The UNETRANS project, funded by ESRI, set out to develop a generic data model for transportation applications, using ESRI's ArcGIS 8 software. This was part of ESRI's series of “essential data models” in various industry groups, e.g. energy, forestry. The transportation data model is called UNETRANS — Unified NEtwork-TRANSportation. UNETRANS works much like a document template in a word processor. It is a starting point, not an imposed standard; and users can modify the template as needed to suit particular purposes (e.g. transit, aviation). UNETRANS was developed in consultation with a consortium of users: highway agencies and DOTs, transit and rail organizations, city streets departments and airport authorities, planning consultants, software developers and university faculty in North America, Europe and the Pacific Rim.

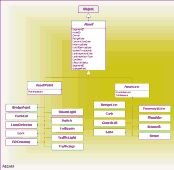
[Click to enlarge]
Figure 1: Extract from UNETRANS data model
Figure 1 illustrates the general structure of UNETRANS, using the Asset component of the model. At the top of the illustration is the generic ESRI geodatabase object.  A UNETRANS asset is an instance of an object, and has a number of essential attribute fields: segment ID, asset ID, owner, design date, construction date, etc. Further down the illustration, assets are divided into two classes: point assets that occur at a single measure (linear reference) along the segment, and linear assets that occur over a stretch of the segment, from measure 1 to measure 2. Loop detectors and traffic signs are examples of point assets.  Guard rails, shoulders and sidewalks are example of linear assets.

A bridge is an example of an asset.  At small map scales such as 1:250,000 a bridge may be represented as a point, whereas at larger scales it may be a line. It could even be a polygon, but that is not a mainstream interpretation and therefore is not included in the published model. Because the model has been developed with a community of users, it should cover the needs of most, but may be customized to suit specialized needs.

Additional resources

Original development at UCSB
ESRI:  www.esri.com  support downloads data models transportation

Contacts

UCSB Mike Goodchild  good [at] ncgia.ucsb.edu
ESRI Ernie Ott  eott [at] esri.com


Home